
Bioregional Mapping
Bioregional Mapping
What is bioregional mapping?
Zooming out, and in again, is part a bioregional or landscape approach. Maps are a visual way of doing this: they can be made from strictly scientific and quantitative data bases, or from artistic and creative starting points and when done well can generate both positive and negative emotional reactions as a response to the stories they tell. The fact that bioregions are by the very nature multi-layered, combining nature and social features, invites us to reach beyond the way maps are more traditionally presented and look for new ways of expressing what change is happening in the places we feel tied to emotionally and pragmatically.
Bioregional Mapping in SE Ireland
A very Irish sense of place
When the Bioregional Weaving Lab started exploring if there was interest and resonance with our work we often took published maps to workshops and asked participants to add where they felt attached to, and why. These connections have been further explored through landscape walks and gatherings. In spring of 2024, a group of stakeholders met in the Irish language speaking area of the bioregion: Gaeltacht na nDéise (read more here). Liam Suipéil, in conversation with Ray McGrath, discussed about how language can link us to place in an enduring and fundamental way. We then walked along the beautiful natural phenomenon that is discussing our own sense of place.
Community led mapping – water quality and conservation in the Anne Valley
In 2023, in collaboration with Dunhill Multi-Education Centre, and thanks to a small grant by Lawpro (Local Authorities Water Programme), we were able to work with the communities of the Anne Valley River catchment and map the diversity of water-related initiatives udnertaken by local residents. The valley has several examples of ‘Integrated Constructed Wetlands’ – a great example of how nature-based solutions can make real difference to water quality. The results of the mapping can be accessed on the map created within Explore-Land. We aim to add this map in future in order to inspire more collective action and impact but also to understand the systemic changes that are needed to drive water quality improvements in this and all other river catchments the bioregion. The Anne Valley community-led water project is part of the 4 Return Valley concept in the Portfolio.
Three Zone mapping
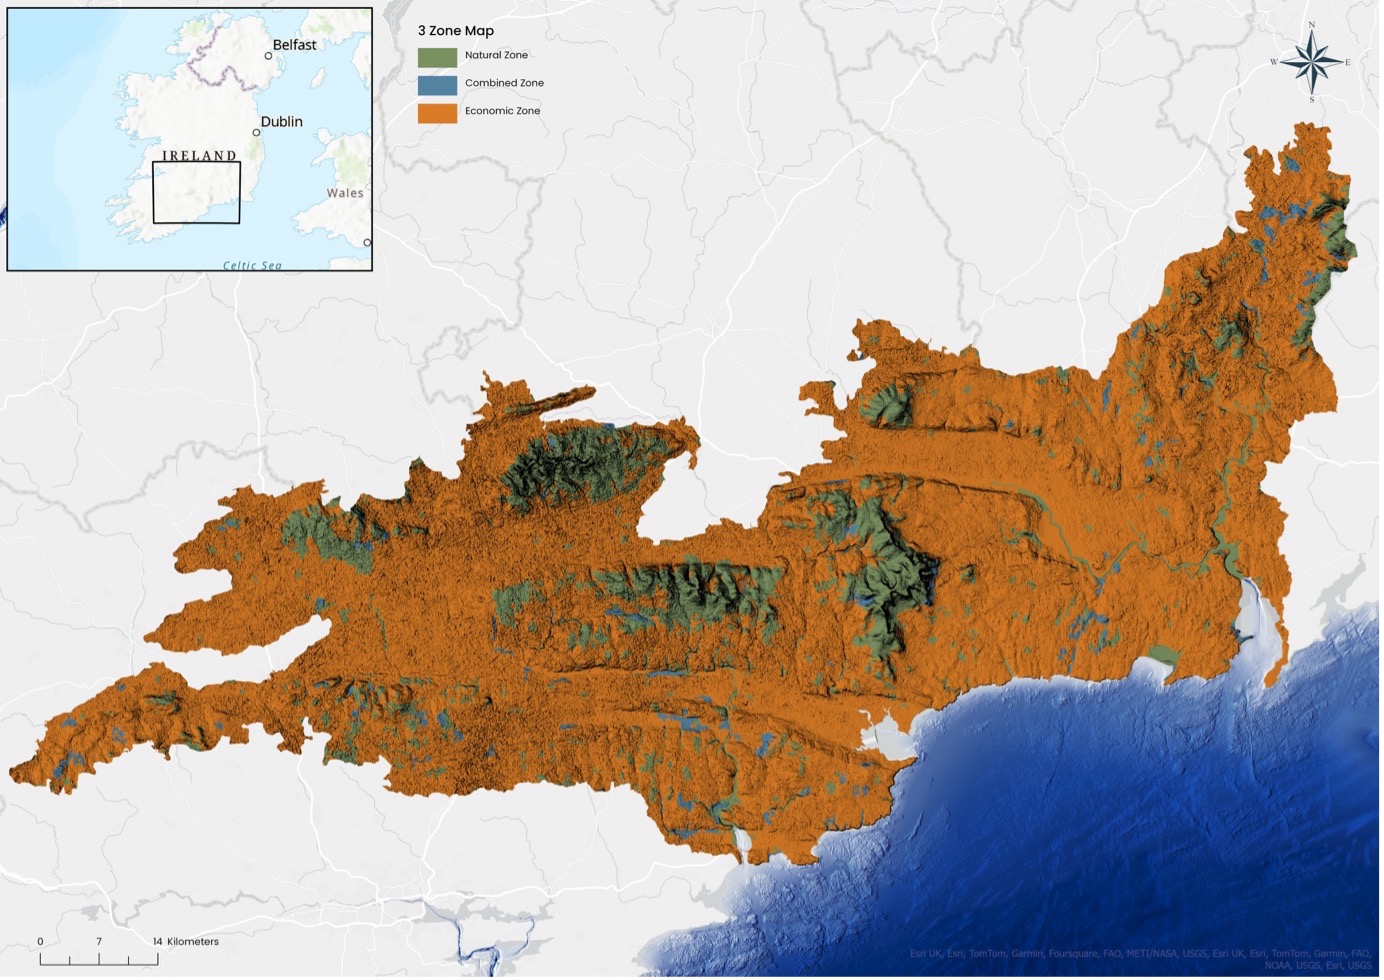
The bioregion stretches from upland areas of heather, bracken and bog, across fertile grass fields with their boundary hedges, through towns and Ireland’s fifth largest city, Waterford, to the coastal areas facing out to the Celtic Sea and the Atlantic beyond. It is a landscape recognizable in three zones described by Commonland and the early work of Patrick Geddes and others.
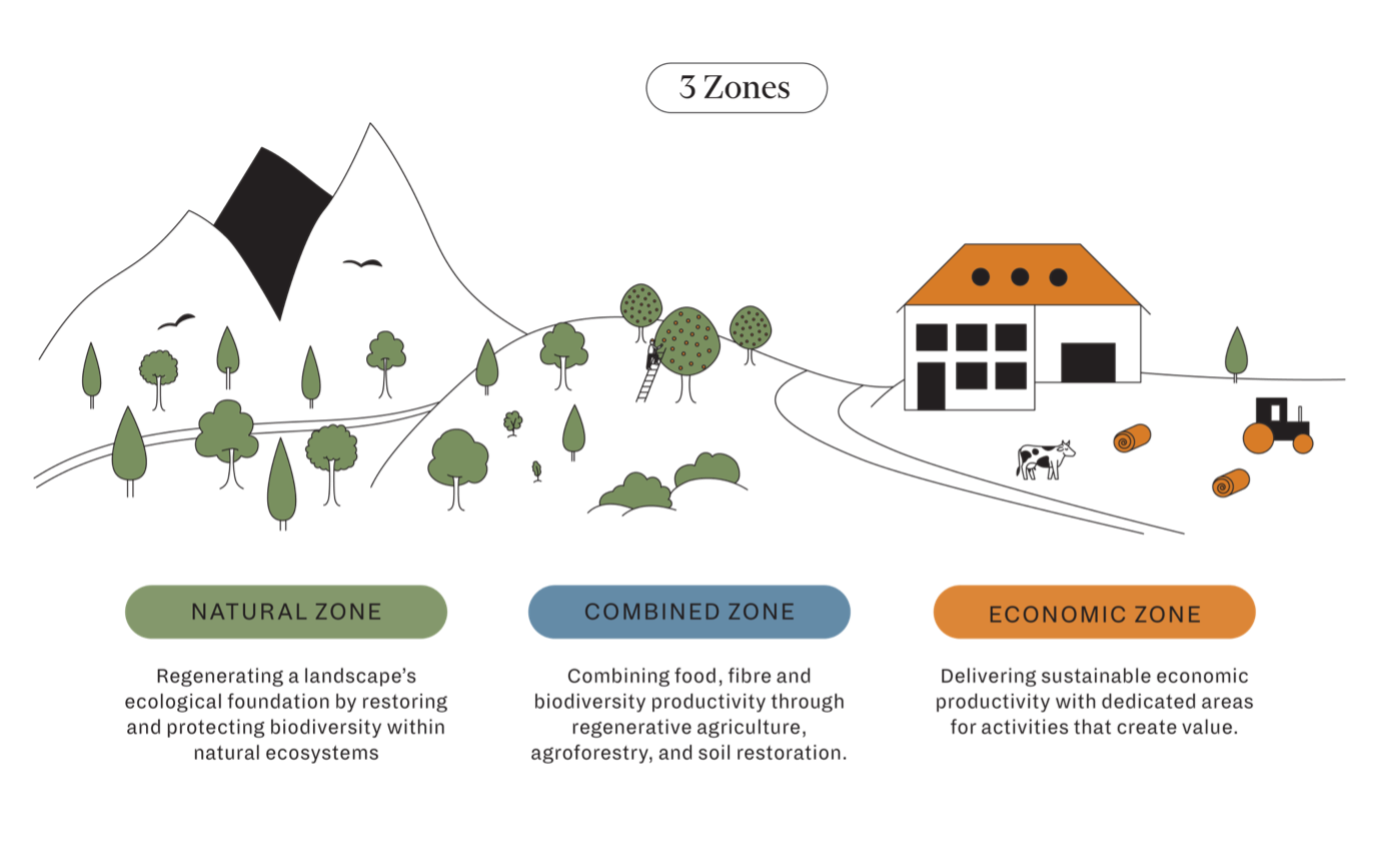
Three Zone Mapping is a way to zoom out and give a clear and easy-to-understand view of a landscape’s functions and inter-connectivity. It is a simplified view designed to generate a reaction to how we as humans are imprinting our activities on ecosystems we live within. From this, collaborative discussions with very different sectors can be had. This in turn may lead to a shared vision of how we would collectively like to see the bioregion in, for example, 20 years’ time.
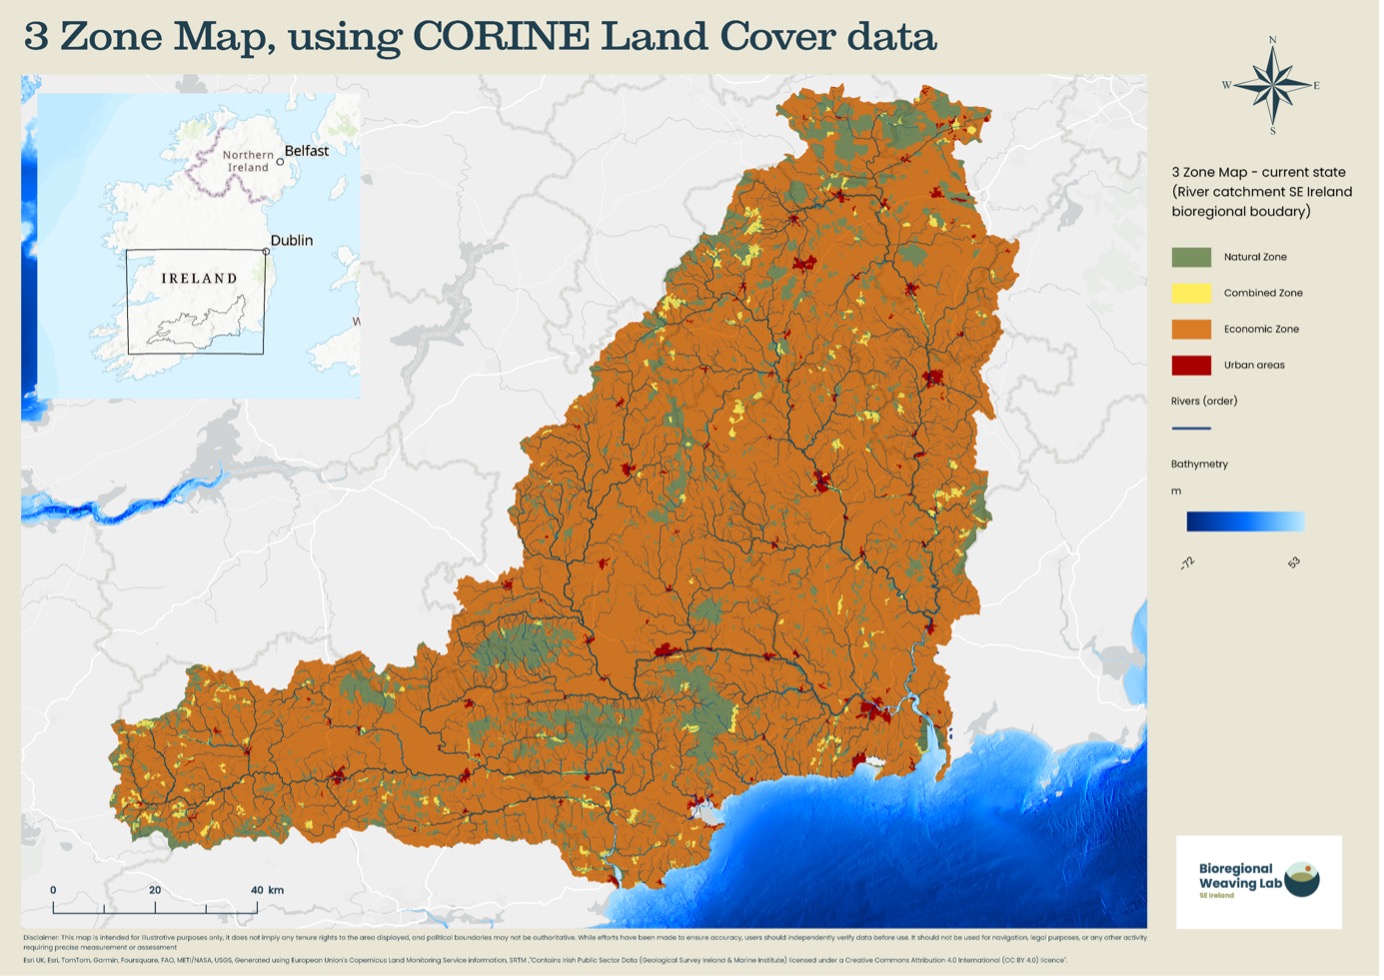
The current Three Zone map was made for an area covering all of the river catchments flowing into, or contained within, County Waterford. It is a strikingly ‘orange’ map suggesting a bioregion overwhelmingly dominated by economic drivers. It is a warning to spatial planners and other decision makers of the precarious state we have reached regarding working in balance with nature.
Below is an expandable list of the maps generated to illustrate the layers that were considered as feeding into our understanding during bioregional mapping process. To date we have only generated layers relating to nature and agriculture, in future these will be joined by social and inspirational layers. The latter may not be expressed in traditional geo-spatial grids and we look forward to seeing how these deeper layers and manifestations emerge.
Bioregions relate to natural boundaries, not to jurisdictional county, region borders. River catchments are fundamental units of a bioregion.
Note: three large rivers, the Suir, Barrow and Nore, reach far north of the County of Waterford where our bioregional work began, reaching well into Counties Kilkenny, Tipperary and Carlow, and a small distance into West Wexford. The major Blackwater River catchment reaches west into County Cork. Many smaller river catchments are grouped into Coast River Catchments and typically flow north-south.
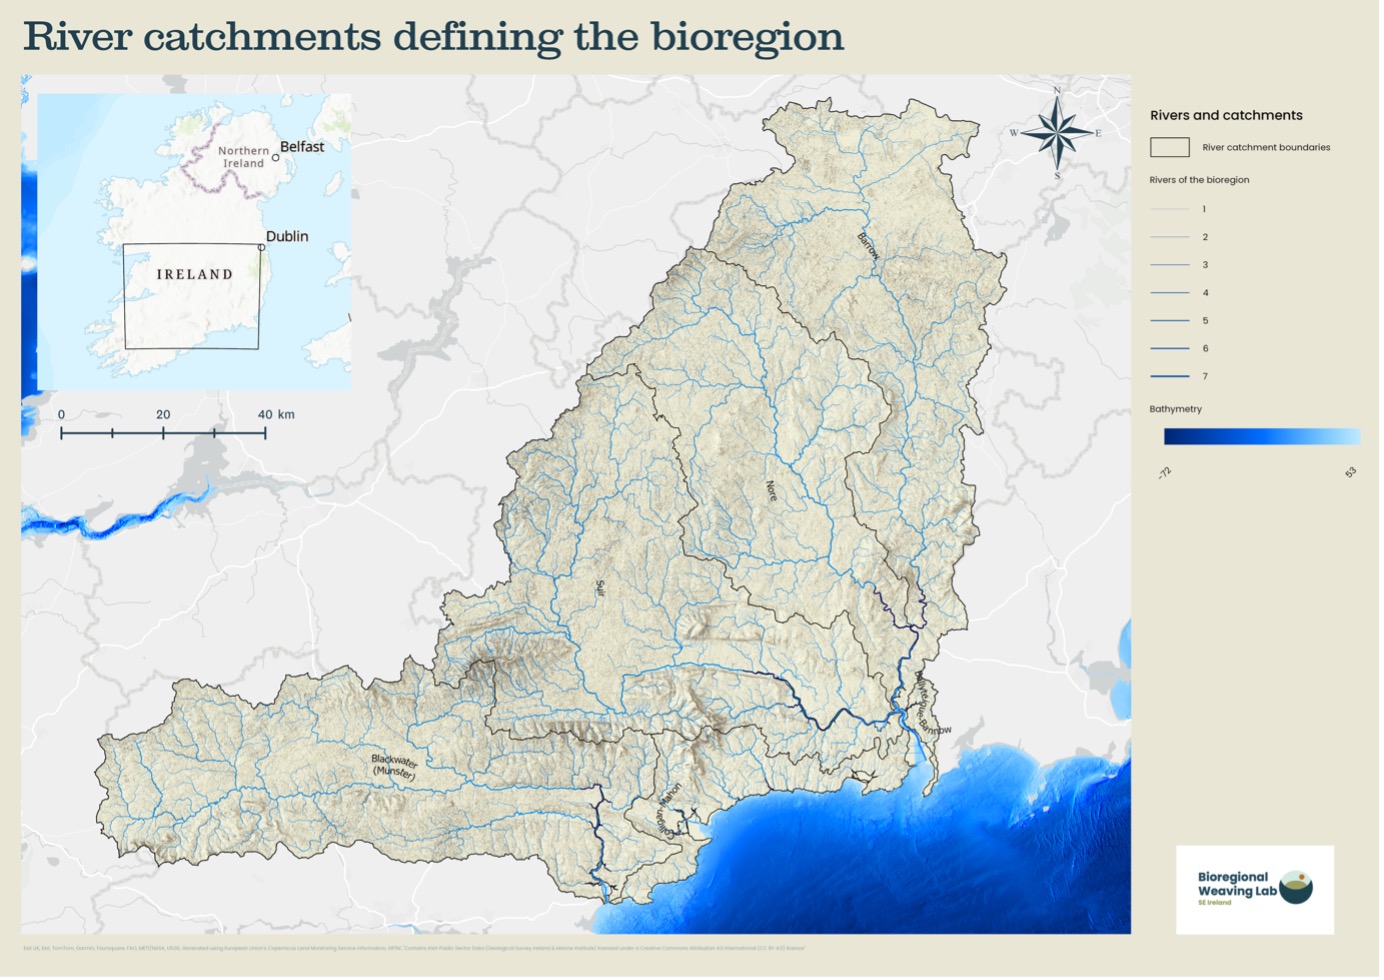
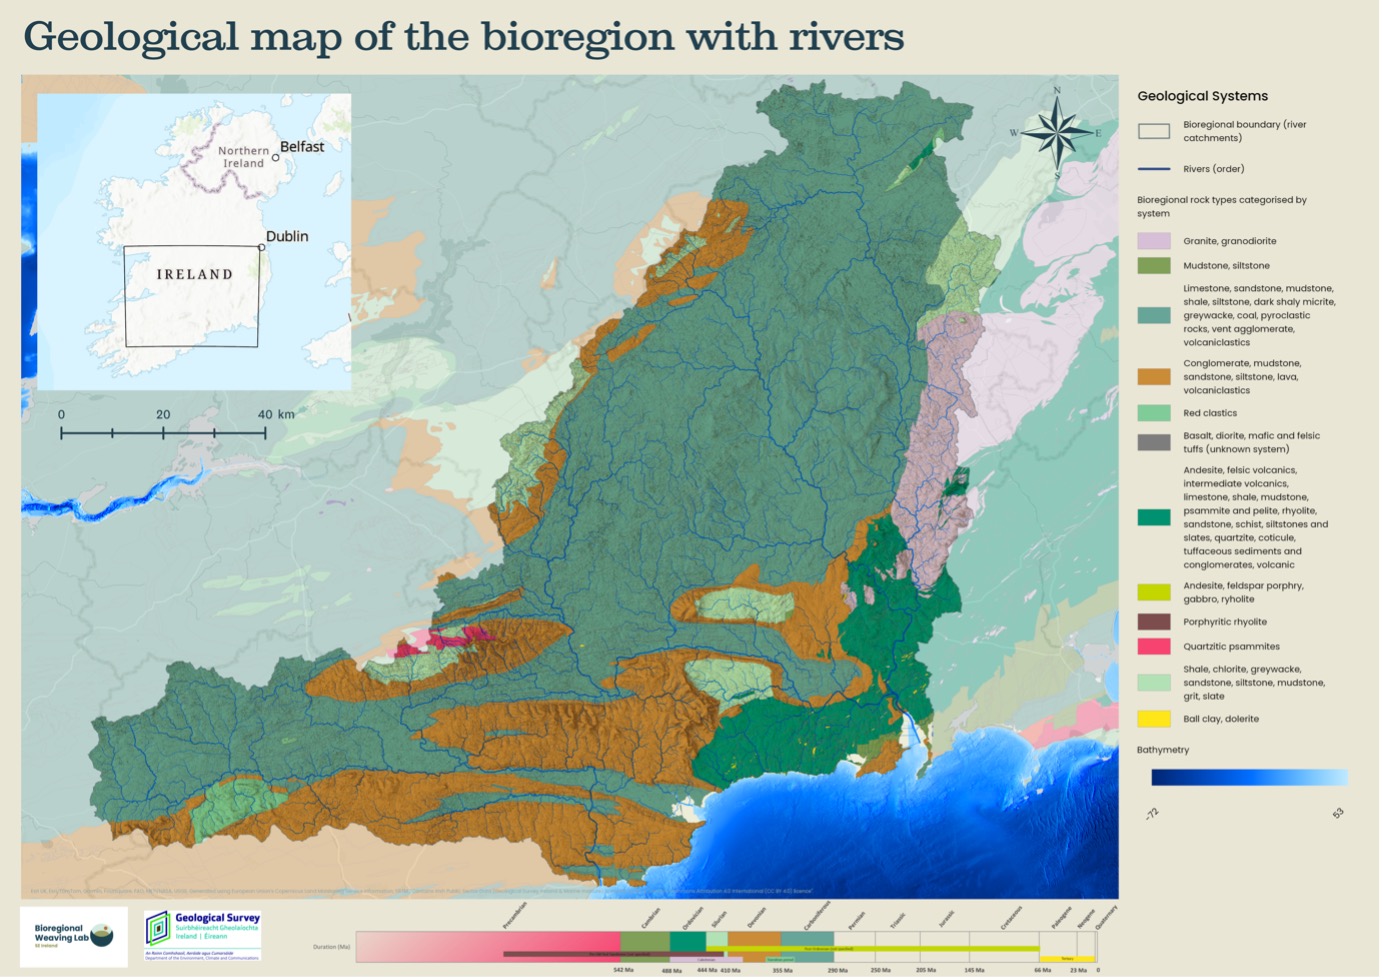
The shape of our bioregion and the landscape that holds us lies in deep time. Even before the ice-age glaciers came and sculpted the surface, it was the geology that determined the variable resistance of the rock types and that influences the relief of the landscape we see today. We started our bioregional mapping by making maps of the geology within the larger area defined by the river catchments. We added shading for the relief and the rivers to facilitate relating rock to the landscape local people most relate to.
Using the standard colours and categories for geology give a map recognizable to geologists, though complicated for non-experts. We therefore grouped many of the subdivisions into formations clustered on rock types and age – for example the Old Red Sandstone (Devonian) coarse sandstones and conglomerates were coloured as one, the limestones of the Carboniferous as another. This simplified map will hopefully be tested to see if farmers and the rural agricultural cultures identify with their land in this way.
The input data set for this map is the CORINE Land Cover and Land Use from 2018. It is not detailed but it still captures the gross use of land in the bioregion. The database is updated with a new status based on changed layers every six years – will we see changes in the next version, or the one after that?
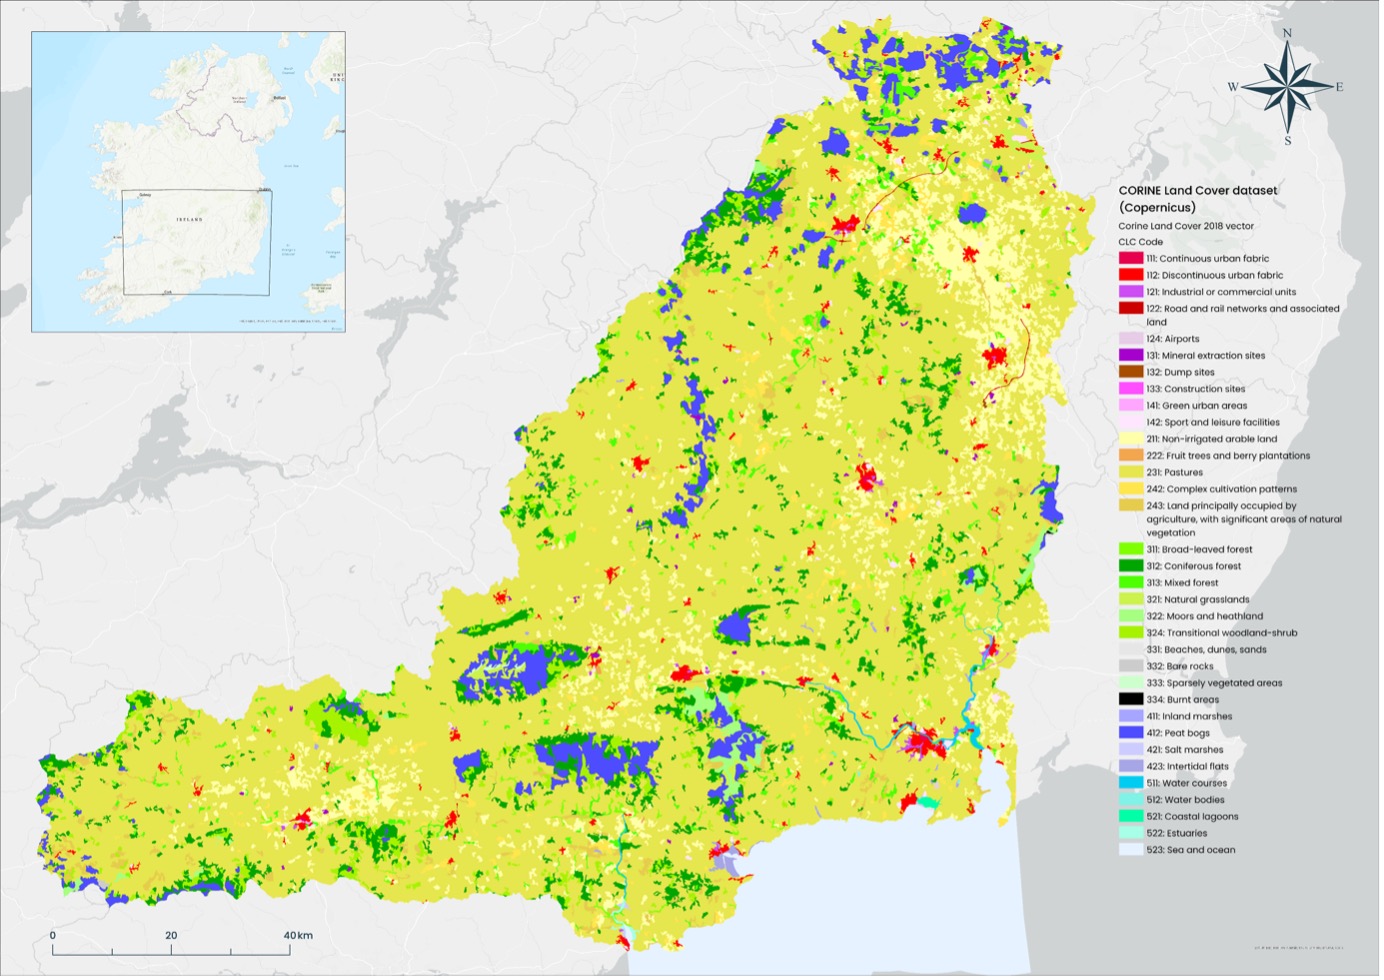
Obvious areas included in the economic zone are urban and industrial areas. Managed forest monoculture (e.g., coniferous forest) are also categorized as ‘economic’. Then we must consider where to place farmland. According to the Three Zone mapping approach, agricultural and agricultural land cover types that don’t contain significant areas of natural vegetation or are not defined as being sustainably managed. All such agricultural land is therefore included in the economic zone In this zoomed out perspective. A response that this does not capture the space for nature that are the hedges and ponds characteristic of many farms, might be made, but when one considers that the average percentage of such space is under 5%, it can be argued that the colour of the map would not change significantly at this overarching perspective.
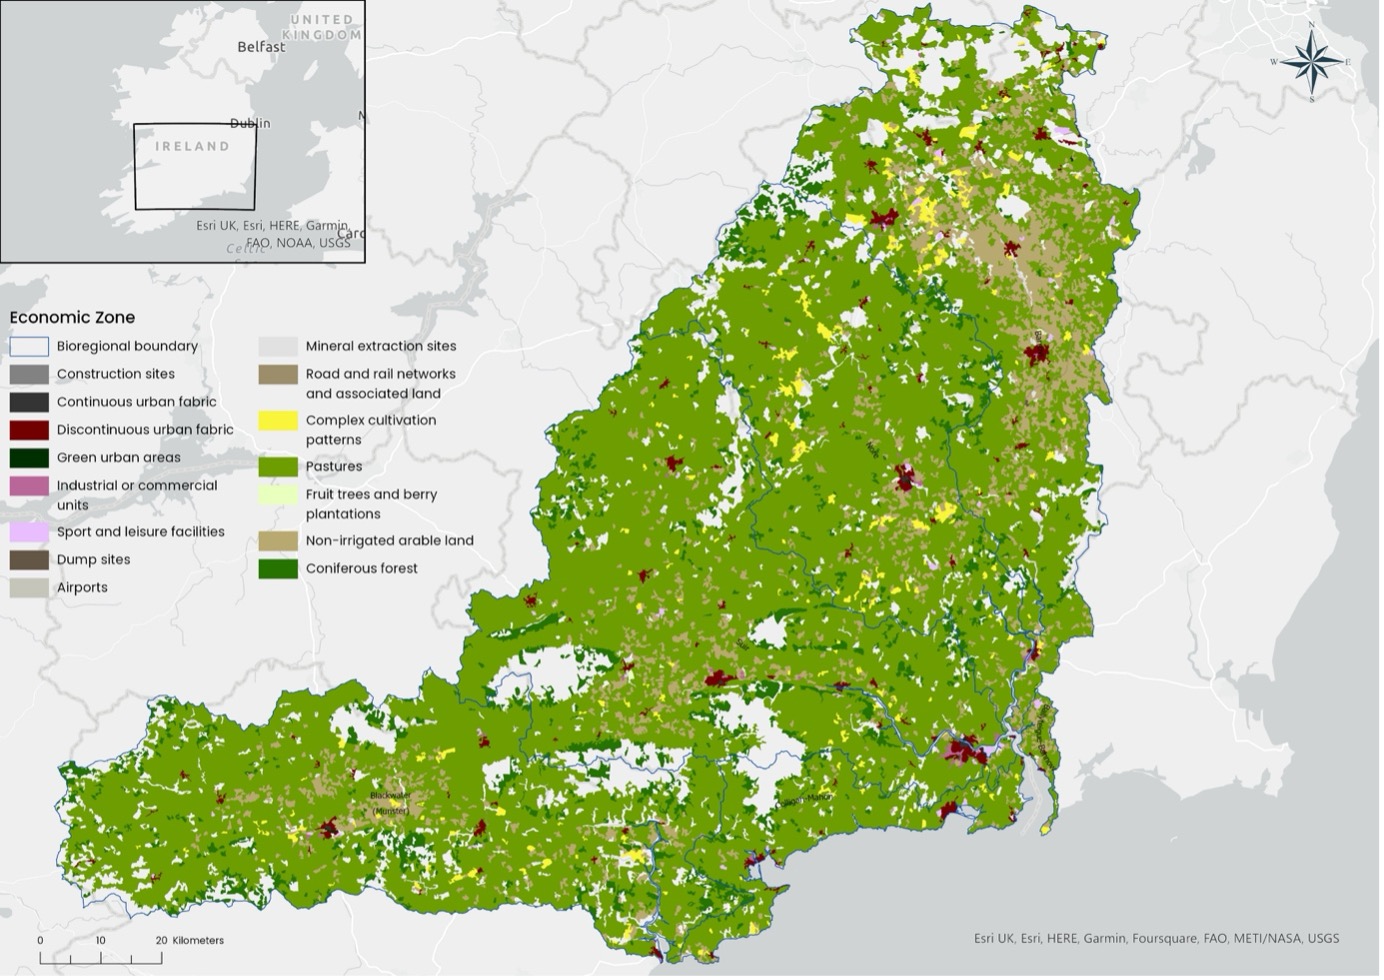
When the economic zone is coloured orange, the combined zone blue, natural zones green, and urban areas highlighted in red (NB such areas are likely to grow) the overall map is strikingly orange.
We have overlain the rivers – sometimes, but not always, included in the natural zone.

The same map zoomed in on the core area of focus (defined by soil types as a proxy for culture and relationship closeness for now).
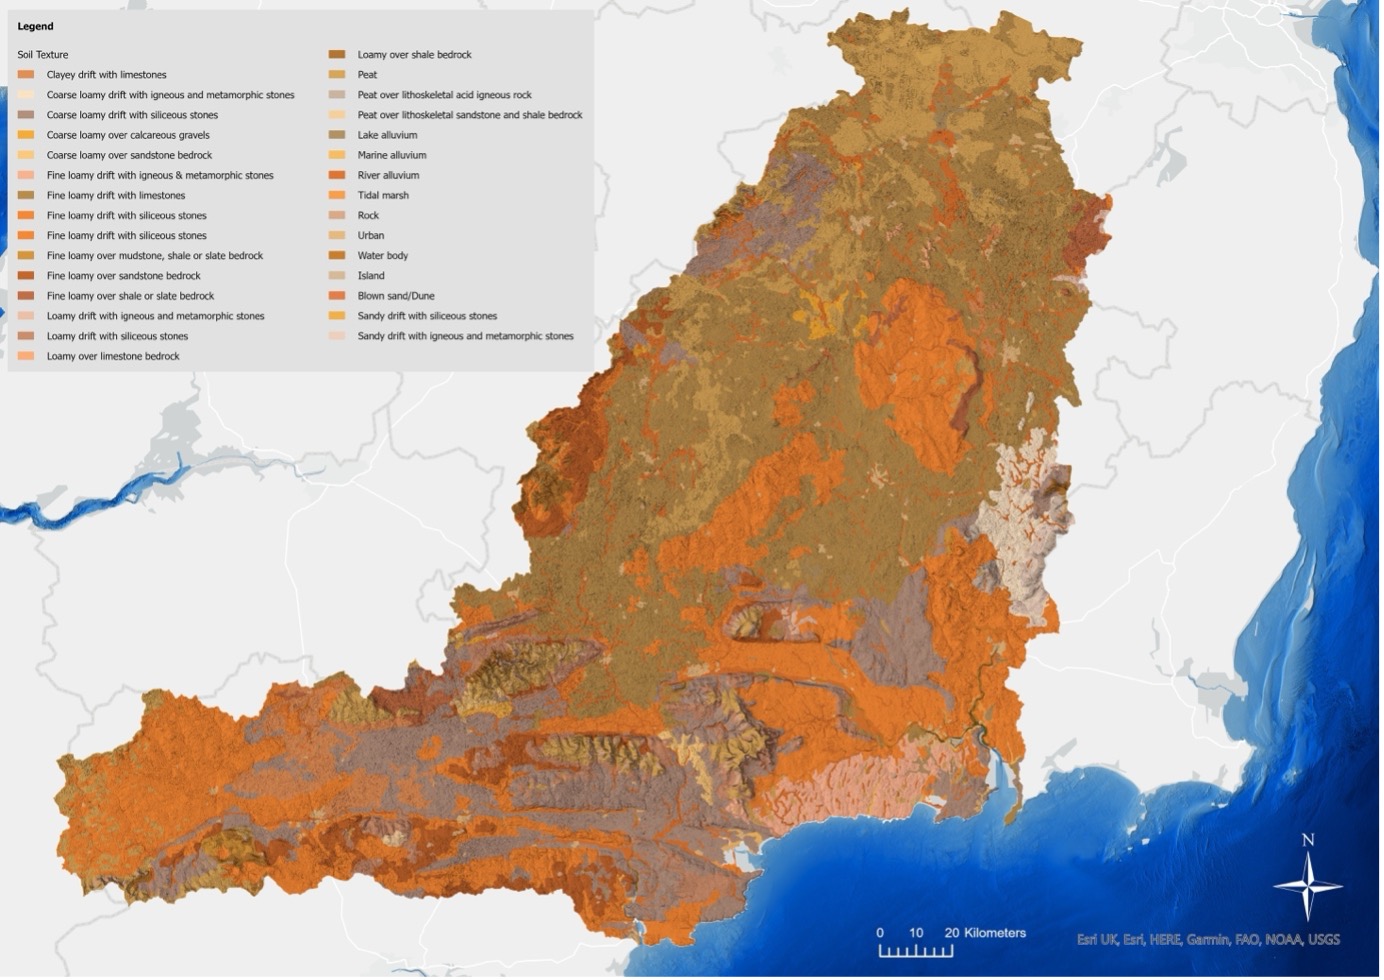 The soil beneath the green grass of the fields and the heather-decked upland hills is a determinant of the type of agricultural development in historical and present times. Through agriculture comes tradition and culture.
We mapped the soil types across the larger bioregion – bounded by edges of the river catchments – and then made a new envelope with the soil types more common in the southern areas. This resulted in an area covering County Waterford and spilling over into adjacent counties, in a way that resonated with the distances where relationships are easily formed and deepened.
The bioregion recognizable as a layering of natural and cultural elements is where we are heading, but we are not there yet in terms of how that will look on a map. If you would like to work with BWL SE Ireland on community-led atlas of this sort, please contact us.
Inspiration of community-led mapping comes from places including:
- ‘The Islands of the Salish Se’a – A Community Atlas. By Sheila Harrington et al.
- Peter Cook – CityScapes. For example in: ‘Peter Cook on Paper’ by Danish Architechtural Press
- ‘This is not an Atlas’ – A Global Collection of Counter Cartographies. Edited by Kollektiv Orangotango.
Thank you to Geological Survey Ireland for a ‘small grant’ to work with and produce the outputs in this phase of bioregional mapping.
Further resources on Bioregional Mapping:
What is bioregional mapping – Department of Bioregions, Watershed Commons